
Guide: According to the basic principles of power economics and power technology economy, this paper explores the relationship between the dynamic balance of power supply and demand and the evolution of urbanization, and forms the standard of economic development stage with unique power characteristics; from the scale and time of power investment demand Departure, form a comprehensive evaluation of the national power investment needs along the “Belt and Roadâ€; brief review of the power supply and demand situation in representative countries along the line.
Under the guidance of the “Belt and Road Initiativeâ€, China's foreign power investment has shown rapid growth under the support of capital and technology. Accurately judging the economic development stage of countries along the “Belt and Road†and comprehensively evaluating the demand for power investment in the countries along the line from the perspective of supply and demand balance, it is of great practical guiding significance for Chinese enterprises to make decisions on foreign power investment.
I. The stage of economic development and the law of power supply and demand development(1) The concept connotation and division criteria of the "economic development stage"
Electricity consumption is closely related to economic growth. Economic development is a process of expanding the scale of the economy and continuously adjusting and optimizing the economic structure. It can be divided into different stages, and different stages of economic development have different industrial structures and consumption structures. American economist Hollis ̇Chinari understands modern economic growth as a comprehensive transformation of the economic structure. According to the level of per capita income, the process of economic growth and structural transformation is divided into different stages. The economic development process can be divided into primary production. Stage, industrialization stage and post-industrial stage (Table 1).
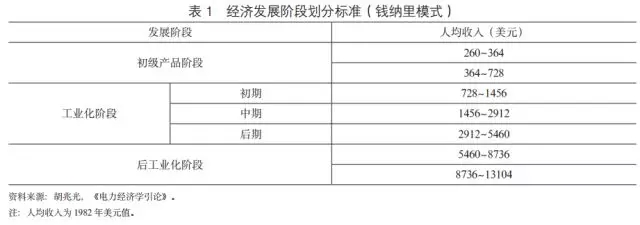
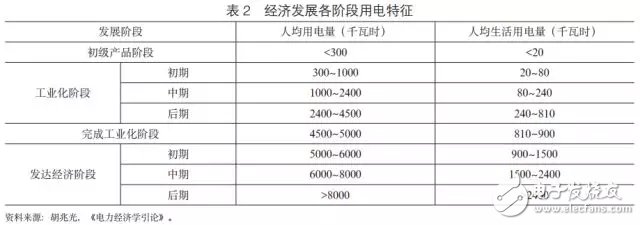
Since the relative value of national currencies changes with time, the per capita income of countries in dollar-denominated prices will change with time, so there is uncertainty about the division of economic development stages. Electricity consumption as a thermometer and barometer for economic operation is also a quantitative indicator for measuring industrial production, energy consumption and economic operation status, and has a leading significance for judging economic operation status and speculating economic operation. Hu Zhaoguang (2013) believes that electricity consumption is positively correlated with GDP, and the economic development stage can be divided according to per capita electricity consumption and per capita living electricity consumption (Table 2).
(II) Dynamic balance of power supply and demand and the evolution of urbanization
The urbanization process promotes the transformation of energy consumption structure, the increase of public energy consumption, the improvement of purchasing power and the change of consumption concept, thereby promoting the growth of power demand. From the experience of China, there is a high correlation between China's urbanization rate and the electricity consumption of the whole society: since 1978, China's urbanization rate and the total electricity consumption of the whole society have been increasing year by year, and the correlation coefficient between them is 0.95; With the increase of urbanization rate, the electricity consumption of the whole society has a quadratic curve. From the international experience, taking the United States, Japan, France, Italy, South Korea, India, Brazil and other seven countries as an example, the correlation coefficient between urbanization rate and total social electricity consumption in these countries from 1961 to 2011 is above 0.8, part The country even exceeds 0.97; with the increase of urbanization rate, the electricity consumption is generally monotonous.
From the stage of urbanization development, when the urbanization rate reaches 25% and 75%, the power consumption growth rate shows a more obvious change. After the urbanization rate of China and Brazil exceeded 25%, the growth rate of electricity consumption showed an increasing trend; after the urbanization rate of the United States, France, Italy, South Korea and Brazil exceeded 75%, the growth rate of electricity consumption slowed down significantly.
According to the characteristics of each stage of economic development, as well as the laws of economic development, power demand growth and urbanization evolution, the urbanization rate can be used as a reference for the division of economic development stage to supplement the standard of per capita electricity consumption during the economic development stage (Table 3). ).
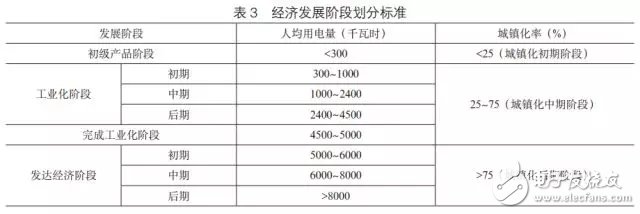
The economic activities in the primary product stage are mainly primary product production, the population is mainly rural residents, and the power demand is growing slowly; the industrial structure in the industrialization stage shifts from primary product production to manufacturing production, and population and employment gradually move to urban and secondary industries. With the transfer, the demand for electricity is growing rapidly; the tertiary industry in the developed economy is developing rapidly, the labor productivity is high, the urbanization rate tends to be stable, the degree of intensification is high, and the growth rate of power demand slows down and tends to be saturated. With the improvement of the economic development stage, the per capita electricity consumption is continuously improved, which is also consistent with the development progress of urbanization. The lower economic development stage has a higher space for the development of the electricity market.
2. Electricity supply and demand situation and investment demand in the country along the “Belt and Roadâ€In the countries along the “Belt and Road†(excluding China), the population, gross domestic product (GDP), electricity consumption, power generation capacity, urbanization rate, average growth rate of electricity consumption in the past three years, nearly three years The average GDP growth rate and other data are used to evaluate the economic development of countries along the route, the power supply and demand situation and the demand for electricity investment.
(1) The overall situation of national economic development and power supply and demand along the “Belt and Roadâ€
The calculation found that in 2015, the population along the “Belt and Road†(excluding China) population totaled 3.21 billion, accounting for 43.69% of the global population; the annual GDP was 12.11 trillion US dollars, accounting for 16.31% of the global GDP; annual electricity consumption 5.27 trillion kWh, accounting for 22.84% of the total annual electricity consumption; power generation installed capacity of 1.475 billion kilowatts, accounting for 23.42% of the total installed capacity of power generation. The average urbanization rate of the countries along the route is 58.93%, which is 4 percentage points higher than the global average urbanization rate.
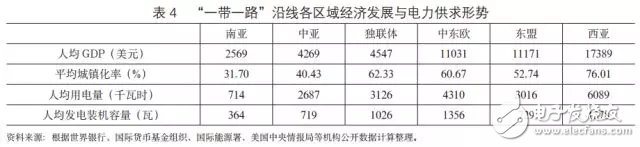
From the “Belt and Road†region, West Asia’s per capita GDP, average urbanization rate, per capita electricity consumption and per capita power generation capacity are the highest, while the above four indicators in South Asia are the worst performers, in line with economic development and power demand growth and urbanization. The law of evolution (Table 4).
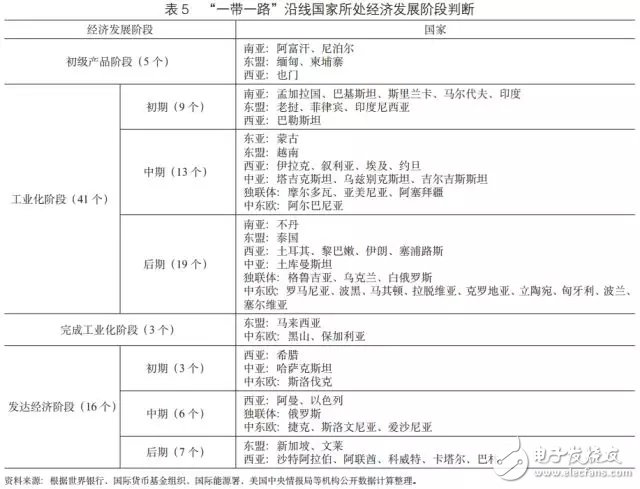
(II) Judging the stage of national economic development along the “Belt and Roadâ€
According to the economic development stage classification criteria in Table 3, the economic development stages of the countries along the “Belt and Road†(Table 5) indicate that most of the countries along the “Belt and Road†are in the industrialization stage, and the power market has great room for development.
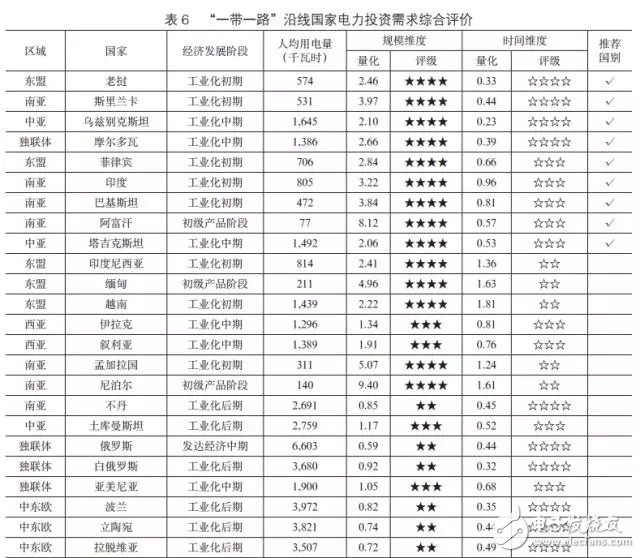
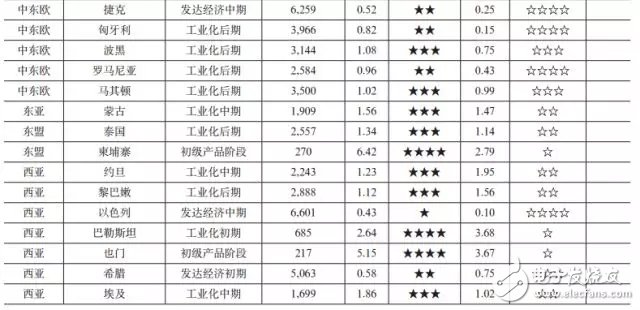
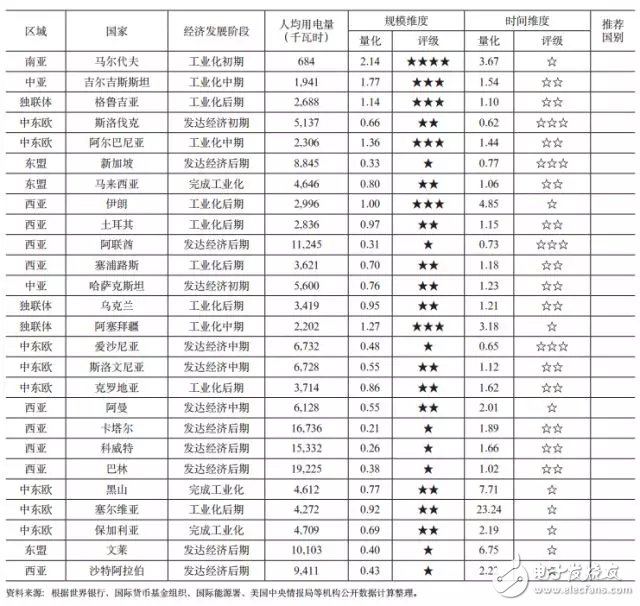
(III) Comprehensive evaluation of national power investment needs along the “Belt and Roadâ€
According to the basic principles of power economics and power technology economy, the following steps are used to comprehensively evaluate the power demand of countries along the “Belt and Roadâ€.
First, per capita GDP, per capita electricity consumption, per capita power generation capacity and urbanization rate are used as factor indicators. The expert scoring method is used to determine the impact weight of factor indicators, and the quantitative indicators of the scale of power investment demand scale are calculated. The larger the value of this indicator, the greater the space for development of the country's electricity market. 0 to 0.49, 0.50 to 0.99, 1.00 to 1.99, 2.00 and above are given one to four stars in order.
Secondly, using the average growth rate of electricity consumption in the past three years and the average growth rate of GDP in the past three years, the power elasticity coefficient is calculated, indicating the time dimension of power investment demand. The value of this indicator is less than 1 and the closer to 0, it means that the country's electricity investment demand is more urgent; the value is greater than 1 and the deviation from 1, means that the country's current power supply is ahead of the economic development level. 0 to 0.49, 0.50 to 0.99, 1.00 to 1.99, 2.00 and above are given four-star to one-star ratings.
Finally, calculate the sum of the scale dimension and time dimension of the power investment demand, and combine the judgments of the economic development stages of each country in Table 5 to form a comprehensive evaluation of the power investment demand (Table 6). Considering the economic development stage of the countries along the line, the scale dimension and time dimension of power investment demand (the sum of the two dimensions is seven to eight stars), Laos, Sri Lanka, Uzbekistan, Moldova, Philippines, India, Pakistan, Nine countries including Afghanistan and Tajikistan have recommended investment countries. It can be seen that whether it is from the scale or urgency of power investment demand, South Asia will be a hot spot for power investment.
Representative countries such as Vietnam, Yemen, Pakistan, Tajikistan, and Macedonia were selected to briefly review the power development situation in these countries.
(1) Vietnam
At the end of 2015, the total installed capacity of power generation in Vietnam was about 38.65 million kilowatts, of which the installed capacity of thermal power was about 13 million kilowatts, the installed capacity of hydropower was 14.64 million kilowatts, the installed capacity of fuel oil was 870,000 kilowatts, the installed capacity of gas was 8 million kilowatts, and the installed capacity of renewable energy was 14 Ten thousand kilowatts, waste-to-energy and small hydropower installed capacity of 2 million kilowatts. In March 2016, Vietnam adjusted its power development plan for 2011~2020 to meet the average 7% growth rate of Vietnam's economy from 2016 to 2030. According to the plan, by 2020, Vietnam's electricity demand will reach 340-370 billion kWh, and the corresponding power installed capacity must reach more than 49.2 million kilowatts. Compared with Vietnam's national power installed capacity at the end of 2015, Vietnam's power installed capacity gap is high. More than 10 million kilowatts.
(2) Yemen
Yemen’s power development and supply are very backward, and the power gap is large, which cannot meet the basic production and living needs of the people. Yemen is one of the few countries in Western Asia with a population of more than 20 million, but the per capita electricity consumption is only 217 kWh, which is less than 4% of the electricity consumption per capita in West Asia. In addition to the relatively backward economy, the lack of relevant resources is also an important factor leading to the backward development of Yemen's power. This also shows that the potential for Yemen's power demand growth is large; once its economic and social development is on the right track, there will inevitably be a broad power market.
(3) Pakistan
At the end of 2016, the total installed capacity of the State Grid of Pakistan was 21.122 million kilowatts, the maximum load was 23.107 million kilowatts, the transmission and stealing losses were nearly 25%, and the actual gap was about 5 million kilowatts. Pakistan has been over-reliant on fuel gas-fired power plants for a long time. Fuel-fired gas-fired power plants account for 56.5%, hydropower accounts for 33.4%, nuclear power accounts for 4.4%, wind power and photovoltaics account for 4.9%, biomass energy accounts for 0.6%, and coal-fired power plants account for Less than 0.1%.
Thanks to the industrial cooperation and upgrading of the China-Pakistan Economic Corridor, the opening and closing of the power transmission and distribution bottleneck in the remote areas, and the increasing load capacity of the transmission network, the severe power supply and demand conflict that has persisted for many years will be basically alleviated around 2019. After entering the dynamic balance of power supply and demand in 2019, the Pakistani government plans to shut down a large number of old fuel and gas units to optimize the power supply structure. The Pakistani power market has strong investment potential. According to the data of the Pakistan National Transmission and Distribution Company, considering the construction, financing, negotiation and planning and development projects, the total installed capacity of the Pakistan National Grid is expected to reach 39.78 million kilowatts by 2020.
(4) Tajikistan
Tajikistan generates about 13 billion kWh of electricity per year, while annual electricity demand is about 23 billion kWh. During the Soviet era, the power gap was mainly solved by imports from Uzbekistan and Kyrgyzstan through the Central Asian power grid. However, Uzbekistan withdrew from the Central Asian power grid at the end of 2009. The power import of the tower was limited, and large-scale blackouts occurred many times. Electrical measures. For example, in the winter and spring of 2015~2016, most cities in the tower have a daily power supply time of 6 to 10 hours, and many remote rural areas provide 2 to 3 hours of electricity per day. The lack of electricity in winter and spring has become a major obstacle to the economic development of the tower and the people's lives.
(5) Macedonia
Macedonia has always been a country with no electricity. The annual electricity consumption is 7-8 billion kWh, while domestic electricity production can only meet 66% of electricity demand. The rest mainly depends on imports from Greece. There are 2 thermal power stations and 29 hydropower stations in Macedonia. The total installed capacity of the thermal power station is 800,000 kilowatts, and the annual power generation accounts for 62.5% of the national power generation; the total installed capacity of the hydropower station is 634,000 kilowatts, and the annual power generation of hydropower accounts for 35% of the national power generation. Macedonia plans to vigorously develop hydropower projects to ease the situation that its electricity is dependent on imports, but due to insufficient funds, the project is basically stagnant.
Fourth, the conclusionAs an industry that plays an important role in the national economy and is closely related to the national economy and the people's livelihood, the power industry has provided a relatively broad stage for countries and enterprises with strong capital and abundant funds because of its high investment threshold. Based on the basic principles of power economics and power technology economy, this paper explores the relationship between the dynamic balance of power supply and demand and the evolution of urbanization, and forms a comprehensive evaluation of the national power investment needs along the “Belt and Roadâ€, with a view to establishing Chinese enterprises along the “Belt and Roadâ€. The state provides a quantitative evaluation plan for the decision-making of power investment.
In order to ensure the comparability and completeness of the research objects, this paper uses the relevant data of 2015 countries published by the World Bank, the International Monetary Fund and other institutions to measure, and then puts forward the key recommended investment countries. Since 2015, a large number of power projects under construction in Laos, Pakistan and other countries have been put into production one after another. The situation of power supply and demand has changed greatly compared with 2015. Through the evaluation method proposed in this paper, rolling statistics and comparative studies can be carried out on countries along the line for a long time.
In addition, due to the difference in power growth potential and actual demand, in the actual decision-making research, in addition to the consideration of supply and demand balance, it is necessary to analyze the political, social, and legal aspects related to the feasibility of investment in the “Belt and Road†countries. The environment is combined with industrial policies such as power import and export and investment control to make comprehensive judgments.
OTHERS FOR Fuel Filter
Others Fuel Filter,Others Auto Fuel Filter,Others Automobile Fuel Filter,Others Car Fuel Filter
Zhoushan Shenying Filter Manufacture Co., Ltd. , https://www.renkenfilter.com