
LED semiconductor lighting network white LED has high luminous efficiency, low power consumption, small size, long life, no mercury, lead and other harmful substances, no infrared and ultraviolet light, etc., is recognized as the fourth generation of green energy-saving and environmental protection light source. With the increasing emphasis on energy conservation and environmental protection, white LEDs have replaced traditional light sources into the general lighting market and have become a major trend in the lighting industry.
At present, there are mainly two ways to prepare white LEDs. One is to obtain white light by mixing "red light chip + green light chip + blue light chip (RGB)", and the other is to obtain "blue light chip + phosphor". White light, while the latter dominates white LEDs. For this main packaging method, the quality of the phosphor determines the color temperature, color rendering index, color uniformity and luminous flux of the light source. Recently, people have higher and higher requirements for the light quality of white LED light sources. In particular, the requirements for indicators such as blue light hazard, glare and color rendering are becoming more and more strict. How can phosphors meet the needs of high-quality light sources?
The light quality of the light source is a comprehensive evaluation, which needs to consider various parameter indexes such as color temperature, color coordinates (color preference), Ra, R1-R15 (especially R9), color saturation, application requirements, etc. The key factor of the parameter indicator is the phosphor. At present, there are eight major series of commercially available LED phosphors on the market: YAG yellow powder with emission peak range from 545 nm to 580 nm, GaYAG yellow green powder with 522 nm to 545 nm, LuAG green powder with 520 nm to 545 nm, and silicic acid of 515 nm to 575 nm. Salt green powder/yellow powder, silicate orange powder at 580 nm-600 nm, nitride red powder at 612 nm-675 nm, oxynitride blue-green powder at 490 nm-500 nm, and fluoride system red powder at 629 nm-632 nm . These commercial phosphors have different parameters such as emission peak, color coordinate, half-width, excitation efficiency, particle size, and surface smoothness, and their applications have their own advantages. In layman's terms, this is like a colored pen for painting. A blue LED is like a paper, and a phosphor is like a colored pen. You can get a color temperature, color coordinates, Ra, R1-R15 (especially R9). ), NTSC, light uniformity and other parameters are not the same as the beautiful "glorious painting".
1. Effect of spectral range of phosphor excitation on light quality
The most fundamental meaning of LED phosphors is to achieve light conversion, that is, to convert blue light into visible light of other wavelengths, and its conversion efficiency is closely related to its excitation spectrum. Figures 1 - 5 are the excitation spectra of some phosphors:
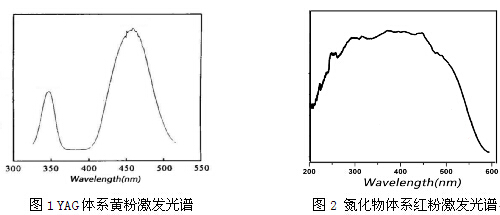
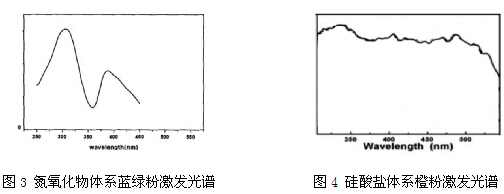
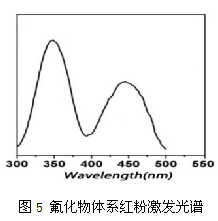
The excitation spectrum of the phosphor determines the conversion efficiency of the 440nm-470nm blue LED chip . As shown in the figure, some of the phosphors commonly found on the market only contain the wavelength range of the blue LED chip, but not all The series of phosphors have the strongest excitation in the wavelength range of the blue LED chip, which means that some phosphors can only be excited by the blue LED chip, rather than the best excitation application, so when using high-efficiency phosphors, It is necessary to select according to the matching of the wavelength of the blue chip and the excitation wavelength of the phosphor.
2. Effect of emission spectrum range and half-width of phosphor on light quality
The emission spectrum of the white LED source is mainly determined by the emission spectrum of the phosphor used. The commercial phosphors commonly available on the market range from 490 nm to 675 nm, corresponding to phosphors of different systems. As shown in Figure 6 below, according to the "Leverage Lightning Principle" of the white LED, as long as the wavelength of the blue chip and the color coordinate of the light source are determined, the chip and the color coordinate point are connected and extended to intersect the chromaticity diagram on the chromaticity diagram. The wavelength A obtained is the wavelength of the phosphor to be matched. For light sources that do not have color rendering Ra and R1-R15 requirements, a single series of phosphors capable of emitting this wavelength A can be directly matched; for light sources with color rendering Ra and R1-R15 requirements, It is necessary to match two or more kinds of phosphors of long-band B and short-band C according to the specific parameters of color rendering Ra and R1-R15, and the polygons of the wavelengths of the phosphors and the wavelength of the blue chip are connected on the chromaticity diagram. The size of the area determines its color saturation. In other words: the shorter wavelength and longer wavelength of the two or more phosphors combined with the blue chip, the white LEDs have higher color rendering Ra and color saturation, but the emission Phosphors ranging from 530 nm to 560 nm have high light efficiency, while the light efficiency of shorter and longer wave phosphors generally decreases with blue or red shift of the wavelength. In general, the color rendering of the LED Ra The higher the color saturation, the lower the light efficiency. In addition, the half width of the phosphor has a great influence on the color rendering Ra, color saturation, and color purity of the LED. Generally, the wider the half width, the wider the range of colors covered, and the color rendering of the LED. Ra, the higher the color saturation, but the lower the color purity.
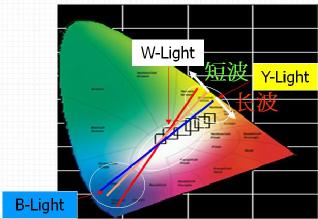
Figure 6 LED phosphor "Leverage light map"
In optical radiation, the visual intensity caused by different spectra is different, and its intensity is evaluated by the spectral efficiency K(λ). In the visible light band, K(λ) has the maximum value Kmax, and the optical performance of the spectrum is normalized. , called the radiation spectral efficiency V(λ):
V(λ)=K(λ)/ Kmax
For the radiation of the same spectral component, the sensitivity of the vision is different. Therefore, the light efficiency is divided into two types: clear visual light efficiency and dark visual light secondary efficiency. When the light intensity is greater than 10 cd/m2, it is a bright visual condition. At this time, the maximum visual response wavelength of the human eye is 555 nm, the spectral efficiency of the wavelength is 1, Kmax is 680 lm/W; when the light intensity is less than 0.01 cd At /m2, it is a dark visual condition. At this time, the maximum visual response wavelength of the human eye is 507 nm, the spectral efficiency of this wavelength is 1, and the Kmax is 1725 lm/W. Figure 7 shows the relative sensitivity of the human eye to the spectrum:
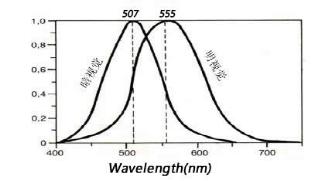
Figure 7 Visual sensitivity of the human eye to the spectrum
In the visible light region of 380-780 nm, the visual light energy φvλ caused by the radiant energy under visual conditions is:
Where Kmax and V(λ) correspond to the maximum optical performance and spectral efficiency under bright visual conditions and dark visual conditions, respectively. Therefore, it can be seen that the white light energy obtained by the phosphor which emits the spectrum of the 555 nm accessory generally has a high energy, while the both ends have a downward trend.
3. Effect of crystal shape roundness, particle size and distribution on light quality
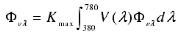
LED white light is realized by the absorption of blue light by the phosphor to convert other visible light, and then the visible light is combined with the blue light, and the light conversion process is affected by the energy level effect of the phosphor itself, and the crystal form smoothness and particle size of the phosphor The size and distribution will also directly affect the light conversion process, which is mainly reflected in the scattering, refraction, reflection, absorption and other effects of blue light. Figure 8 is a schematic diagram of the phosphor light conversion process.
Figure 8 Schematic diagram of the phosphor light conversion process
It can be seen from the figure that if the crystal shape of the phosphor is not smooth, the reflection cross section is increased, the amount of reflection generated is increased, and the amount of light is reduced. Theoretically, the closer the crystal form of the phosphor is to a spherical shape, the weaker the reflection effect is, and the better the light conversion effect is.
It can be seen from Fig. 7 that the light emitted by the phosphor has higher optical performance than the blue light emitted by the chip, so that the blue light is improved by the conversion of the phosphor into other visible light, and the luminous flux of the entire spectrum is increased, and the luminous flux of the LED light source is increased. At the same time, however, the phosphor itself has a reflective effect on the blue light and the visible light it converts. Among them, the smaller the particle size of the phosphor, the smaller the mean free path (the mean free path is the average distance between the photon and the secondary collision between the phosphor particles during the propagation process, the smaller the mean free path, the more the number of collisions and the probability Large), the greater the reflectivity, the increased energy loss, which is not conducive to the emission of light. As the particle size of the phosphor increases, the angular distribution of light scattering becomes smaller, the energy is concentrated forward, more light energy is emitted, and the luminous flux is increased. However, to achieve the same color temperature, the larger the phosphor particles, the higher the concentration of phosphor required. As the phosphor concentration increases, more visible light is converted or reflected by the phosphor, which can result in The trapping effect of the phosphor is dominant, and the effect of the reflection loss of the light is greater than the effect of the attraction conversion, and the light energy will decrease.
The distribution of phosphors is generally evaluated by the dispersion S:
S=(D90-D10)/D50
In the formula, D90, D10, and D50 are respectively the particle sizes corresponding to the cumulative distribution of the phosphors of 90%, 10%, and 50%, wherein D50 is also referred to as the center particle diameter of the phosphor. The larger the dispersion of phosphor particles, the wider the particle size distribution range. Due to the different scattering power of different particle sizes, the scattering mismatch between particles, the scattering cross section becomes larger, and the scattering ability of phosphors to light is stronger. The more obvious the light trapping effect, the smaller the amount of light emitted. In addition, as the phosphor trapping effect is enhanced, more light energy is attracted by LED chips , encapsulants and the like and released in the form of heat, resulting in an increase in junction temperature, lowering the photoelectric conversion efficiency of the chip and the light of the phosphor. Conversion efficiency.
Keheng is a listed company with luminescent materials as its main theme and listed on the Shenzhen GEM. It has been the world's largest manufacturer of luminescent materials for 14 consecutive years. It is a high-tech enterprise integrating R&D, production and sales. He has deep experience in the development, production and application of phosphors. In terms of LED phosphor products, Keheng has a complete range of products and a wide range of specifications and models. It covers a wide range of excitation wavelengths and emission wavelengths, and the particle size can be customized. The crystal shape and dispersion of the powder are good. , continuous research and development and rapid improvement, is a well-received company that is well received by the market.
ZGAR electronic cigarette uses high-tech R&D, food grade disposable pod device and high-quality raw material. All package designs are Original IP. Our designer team is from Hong Kong. We have very high requirements for product quality, flavors taste and packaging design. The E-liquid is imported, materials are food grade, and assembly plant is medical-grade dust-free workshops.
From production to packaging, the whole system of tracking, efficient and orderly process, achieving daily efficient output. We pay attention to the details of each process control. The first class dust-free production workshop has passed the GMP food and drug production standard certification, ensuring quality and safety. We choose the products with a traceability system, which can not only effectively track and trace all kinds of data, but also ensure good product quality.
We offer best price, high quality Vape Device, E-Cigarette Vape Pen, Disposable Device Vape,Vape Pen Atomizer, Electronic cigarette to all over the world.
Much Better Vaping Experience!
E-Cigarette Vape Pen,Disposable Device Vape,Vape Pen Atomizer,Latest Disposable E-Cigarette OEM vape pen,OEM electronic cigarette
Shenzhen WeiKa Technology Co.,Ltd. , https://www.zgarvapor.com