
Valgrind can detect memory leaks and memory violations, but using the log information generated by Valgrind in combination with kcachegrind allows you to view the execution diagram of a C program. Call time is an excellent tool for optimizing performance and viewing code.
1. Download and install
Valgrind installation
To download the latest version of valgrind
# wget http://# tar -xvf valgrind-3.9.0.tar.bz2 # cd valgrind-3.9.0 # ./configure # make && make install
2. Valgrind shows Valgrind is very simple to use, valgrind command format is as follows: valgrind [valgrind-options] your-prog [your-prog options] Some commonly used options are as follows: Option Function -h --help Displays help information. --version displays the version of the valgrind kernel, and each tool has its own version. -q --quiet runs silently, only prints error messages. -v --verbose Prints more detailed information. --tool= [default: memcheck] The most common options. Run the tool named toolname in valgrind. If you omit the tool name, memcheck is run by default. --db-attach= [default: no] binds to the debugger for debugging errors.
3. Use Valgrind to analyze Nginx
This is the normal Nginx startup command
#/usr/local/nginx/sbin/nginx -c /usr/local/nginx/conf/nginx.conf
Use Valgrind's callgrind to analyze program efficiency
# valgrind --tool=callgrind /usr/local/nginx/sbin/nginx -c /usr/local/nginx/conf/nginx.conf
Press Ctrl+C to end and generate the callgrind.out.2026 file in the valgrind installation directory
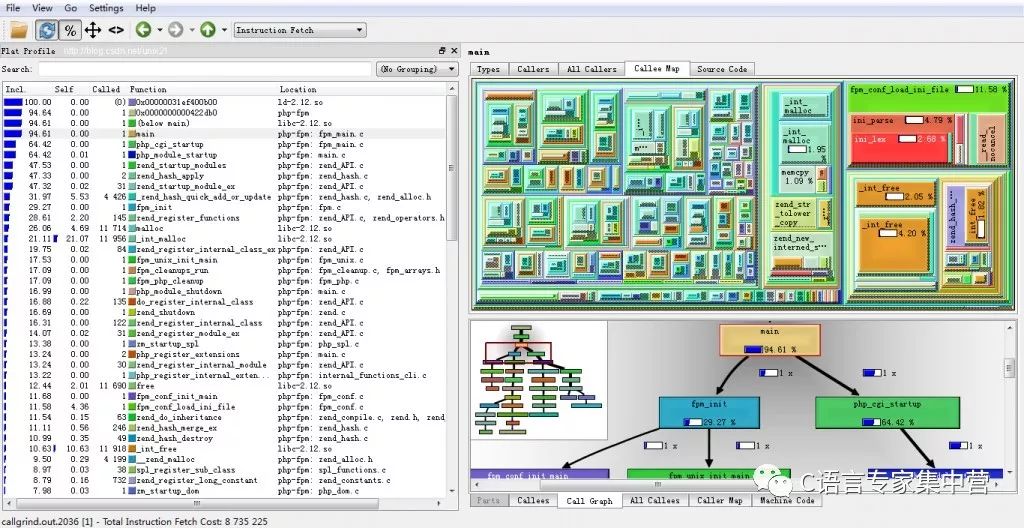
4.kcachegrind graphical display
Use the kcachegrind tool to open, right-export pictures
1). Overview map
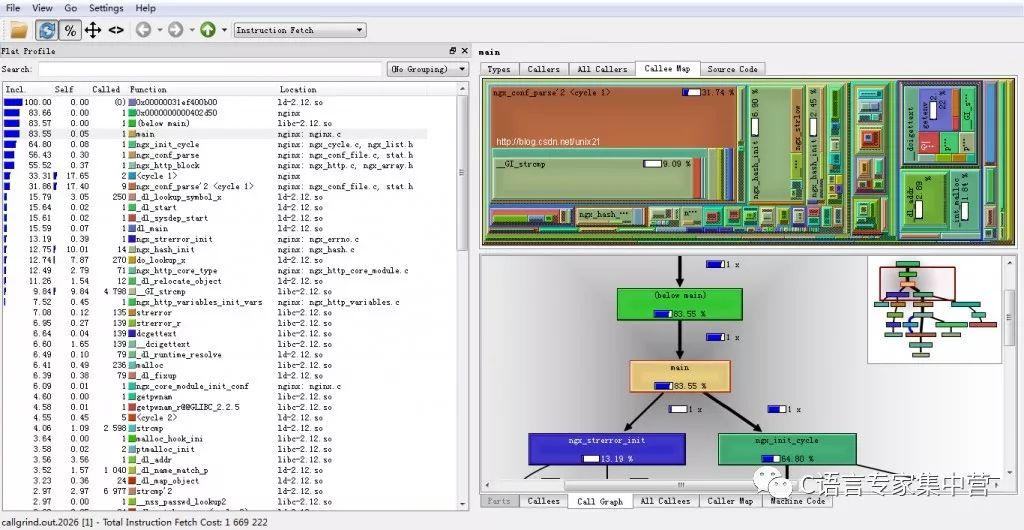
Can right-click graphics
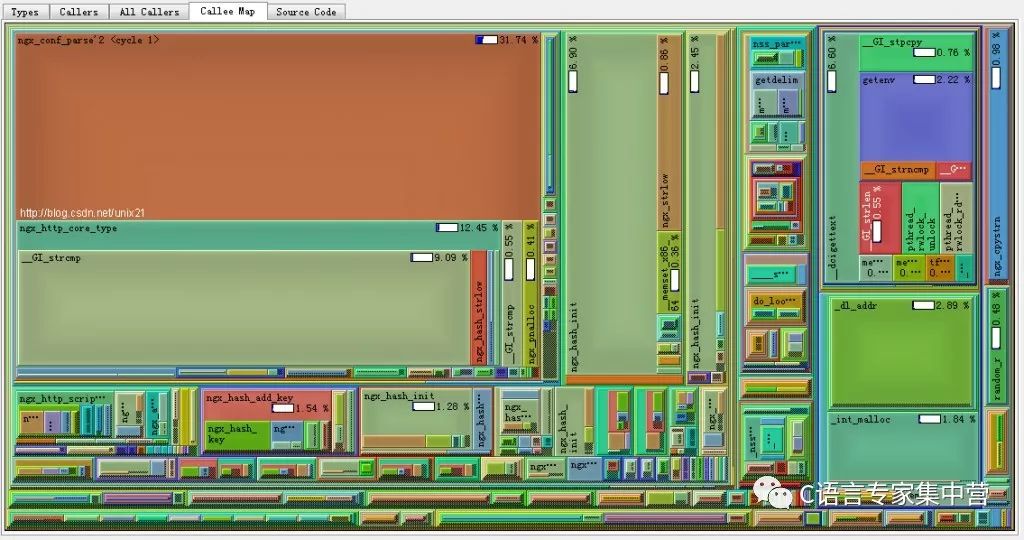
2). The percentage of program module execution
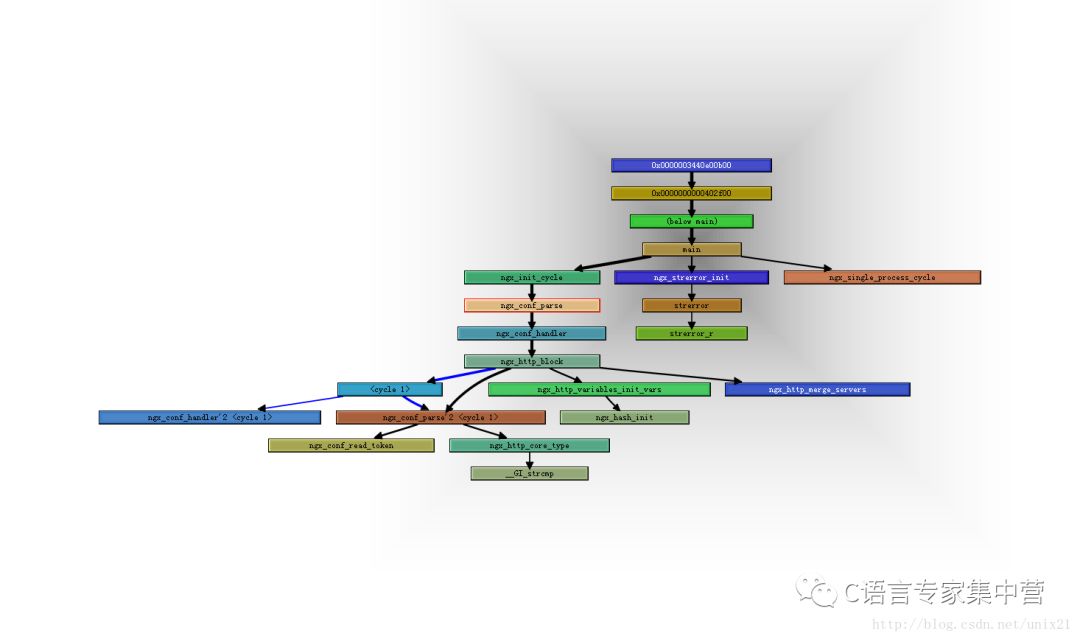
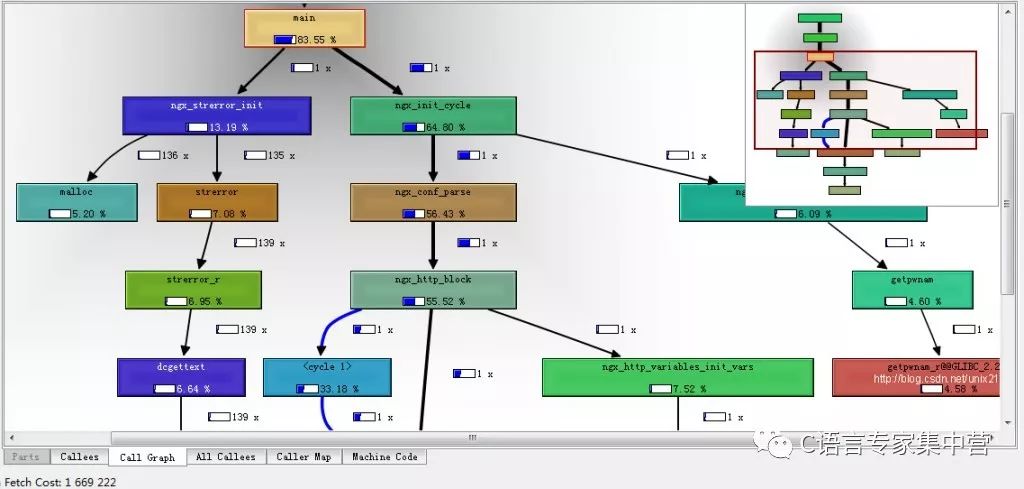
3). Program module call diagram
# valgrind --tool=callgrind /etc/init.d/php-fpm
PHP-FPM analysis diagram
More complicated
5.Valgrind tool 1).Memcheck the most commonly used tool used to detect memory problems in the program, all read and write memory will be detected, all calls to malloc () / free () / new / delete will be It is captured. Therefore, it can detect the following issues: 1. Use of uninitialized memory; 2. Read/write freed memory blocks; 3. Read/write out of memory blocks allocated by malloc; 4. Read/write inappropriate stacks Memory blocks; 5. Memory leaks, pointers to a piece of memory are lost forever; 6. Incorrect malloc/free or new/delete match; 7. The dst and src pointers in the memcpy() related function overlap. These problems are often the most troublesome issue for C/C++ programmers. Memcheck has done a great job here.
2) Callgrind and gprof are similar analysis tools, but its observation of the operation of the program is even more subtle and can provide us with more information. Unlike gprof, it does not require the addition of special options when compiling the source code, but the addition of debugging options is recommended. Callgrind collects some data while the program is running, creates a function call graph, and optionally performs a cache simulation. At the end of the run, it writes the analysis data to a file. Callgrind_annotate can turn the contents of this file into a readable form. Callgrind is more useful than Cachegrind. Callgrind is implemented on the basis of Cachegrind, which can visualize the function call relations and the cost of each function during the entire process running.
3).Cachegrind Cache analyzer, which simulates the primary caches I1, D1, and L2 caches in the CPU, and can accurately indicate the cache misses and hits in the program. If necessary, it can also provide us with the number of cache misses, memory references, and number of instructions per line, each function, each module, and the entire program. This is a great help to the optimization process.
4). Helgrind It is mainly used to check the competition problem in the multi-threaded program. Helgrind looks for areas of the memory that are accessed by multiple threads without consistently locking. These areas are often places where threads lose synchronization and can cause difficult-to-examine errors. Helgrind implemented a competition detection algorithm called "Eraser" and made further improvements to reduce the number of reported errors. However, Helgrind is still in the experimental stage.
Massif stack analyzer, which measures how much memory the program uses in the stack, tells us the size of the heap block, heap management block, and stack. Massif can help us to reduce the use of memory. In modern systems with virtual memory, it can also speed up the operation of our programs and reduce the chance that the program will stay in the swap area. In addition, lackey and nulgrind are also available. Lackey is a small tool that is rarely used; Nulgrind just shows developers how to create a tool. We will not introduce it.
6. Valgrind analyzes memory leaks
#include
#include
Void f( void )
{
Int * x = malloc(10 * sizeof ( int ));
x[10] = 0; // problem 1: heap block overrun  Â
} // problem 2: memory leak -- x not freed  Â
Int main( void )
{
Int i=0;
f();
Printf( "i=%d/n" ,i); //problem 3: use uninitialised value. Â Â
Return 0;
}
Save it as memleak.c and compile it, then check it with valgrind. # cc -Wall -o memleak memleak.c # valgrind --tool=memcheck ./memleak
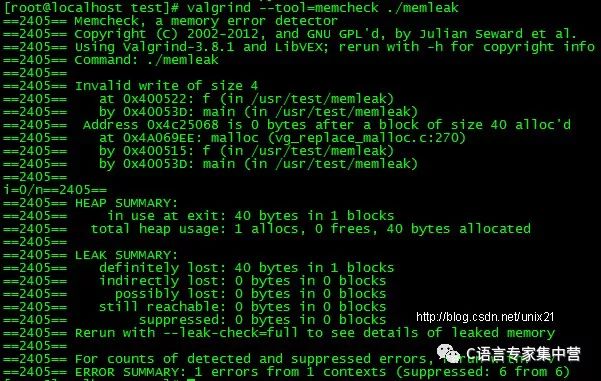 The preceding 2405 is the process number when the program was run. The first line tells us the type of error, which is an illegal write. The following is to tell us where the error occurred, in the f() function of main() call. At the end of the program run, valgrind also gives a small summary of SUMMARY. We can clearly see how much memory is allocated and freed, and how much memory is leaking. This is very convenient for us to find memory leaks .
Recompile the program and bind the debugger: # gcc -Wall -ggdb -o memleak memleak.c # valgrind --db -attach=yes --tool=memcheck ./memleak An error occurs, valgrind will automatically start the debugger (generally Is gdb): 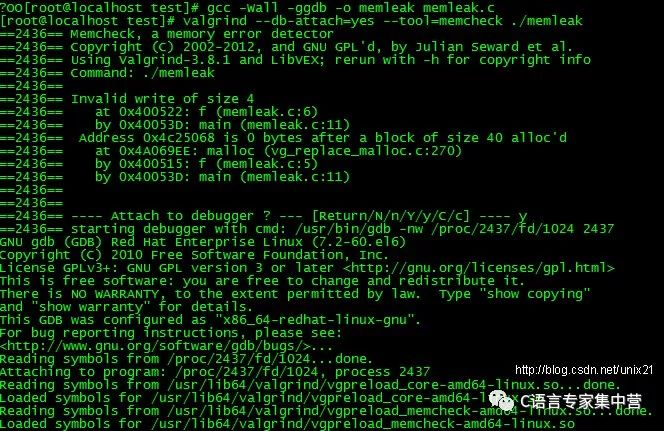
# valgrind --tool=cachegrind ./memleak
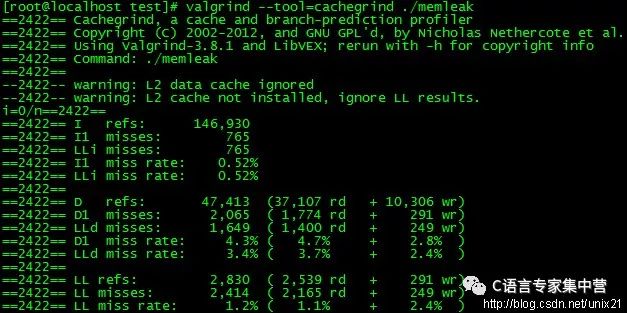
The above is the instruction cache, I1 and L2i cache, access information, including the total number of visits, the number of losses, the loss rate. The middle is the data cache, the D1 and L2d cache, the access related information, and the L2 cache below the separate information. Cachegrind also generates a file called cachegrind.out.pid that can be read by cg_annotate. The output is a more detailed list. Massif is similar to cachegrind, but it also generates a PostScript file called massif.pid.ps, which contains only a color picture that describes the stack usage.
M12 circular connector, a high-level connector that complies with EU standards. With high signal integrity and excellent performance.
M12 circular connector, combining power lines and data lines, is characterized by reduced footprint and reduced installation and cost, suitable for process automatic control and industrial applications, automation equipment, electronic equipment, electronic instrumentation, Sensors, commercial transportation, and Military/Aerospace Applications.
Using 4/5/8 contacts, all capable of carrying a current of up to 4A per contact. The injection molding technology used in the product ensures a perfect IP67 rated seal and provides reliable strain relief.
According to the shape: circular electrical connectors (also divided into M12 connectors, M8 connectors), rectangular electrical connectors (heavy-duty connectors).
The M12 circular connector plays the role of signal connection between various instruments and equipment.
The main product types of M12 circular connectors are with cable and without cable, and the cable length can be customized according to user requirements.


M12 Connector,M12 power connector,Right Angle Connector,M12 panel mount Connector, M12 shielded connector
Kunshan SVL Electric Co.,Ltd , https://www.svlelectric.com