
This article introduces a digital frequency meter modified with a six-function electronic watch, which has the characteristics of low cost, simple debugging and convenient reading, and is suitable for beginners to make.
Working principle: It can be known from the principle of six-function electronic watch (hereinafter referred to as “tableâ€) that when the “table†is placed in the “running timekeeping†working state, after pressing the “ADVANCE†button twice, the “table†is displayed. It is the interval between two key presses. If the interval time is T and the apparent value is M, then M=T·F/N (F is the signal frequency injected into the table, and N is the division factor of the table). When T = N (or T = N & TImes; 10-x), then F = M (or F = M & TImes; 10x), that is, the apparent value M is the signal frequency F input to the table. This is the basic working principle of this frequency meter.
The circuit is as shown.
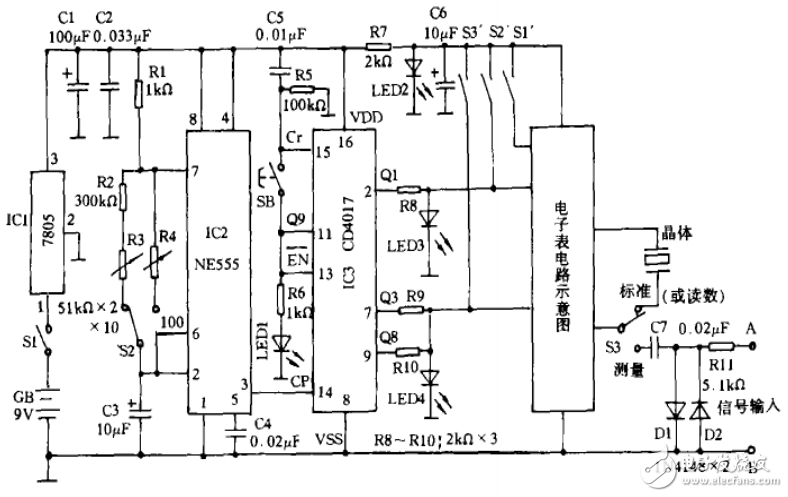
The 9V power supply provides stable 5V working power for IC2 and IC3 through IC1 voltage regulation. The 5V power supply is stepped down by R7 and LED2 to provide 1.5V power for the electronic watch. IC2 and IC3 complete the clearing of the table and generate standard key pulses of T=N&TImes; 10-x (32.80S and 3.28S). S2 is the gear position change switch, divided into two parts of &TImes; 10 and ×100, the unit is HZ; SB is the measurement button; S1'~S3' are the "MODE", "SET" and "ADVANCE" buttons of the table respectively. The working process is as follows: When the power is turned on, the self-excited oscillator composed of IC2 (NE555), R1~R4 and C3 oscillates. IC3 (CD4017) starts counting after clearing through C5. After a certain time, Q9 outputs a high level, due to Q9. Connected to the EN terminal, IC3 counting stops. After that, press S1' to switch the watch to the "running time" state. When measuring, the signal to be tested is connected to both ends of A and B. S3 sets the measurement bit. After the signal is limited by R11, D1 and D2, it is coupled to the table through C7. Press SB, the high level of Q9 makes IC3 clear and again. count. As the IC2 pulse is continuously input, Q1 to Q9 of IC3 sequentially output a high level. When Q1 outputs a high level, it is equivalent to pressing the S2' key, and the table clears "0" (displayed as 0:00oo); when Q3 outputs a high level, it is equivalent to pressing the S3' key, and the table starts timing (actually Count); When the Q8 output is high, it is equivalent to pressing the S3' button again, and the meter timing stops. At this time, the displayed value is the number of pulses (ie, frequency) that enters the table within 5 pulse periods of IC2 output. When the Q9 output is high, the IC3 count stops and a measurement process is completed. R8 ~ R10, LED3 and LED4 are used to limit the voltage input to the "key" terminal of the table; LED1 is used to measure the indication, and emit light after the measurement is completed, so that the measurement time has expired and can be read.
Component selection: S1 is the power switch, S2 and S3 select the single-pole double-throw small toggle switch, and SB is the measurement push button switch. In order to ensure the stability and accuracy of the measurement, C3 needs to select a tantalum capacitor with a small leakage current with a withstand voltage of 16V, R1 to R2 preferably with a 1/4W metal film resistor, and R3 and R4 with a 1/2W 51K linearity. Trim the potentiometer. In order to facilitate the installation, the electronic watch needs to use a BP machine type electronic watch with a "running watch" function. The selection of other components is as shown.
Production and commissioning: Open the electronic watch and carefully remove the circuit board, find the power (+) and (-) poles of the watch, and the contacts of the “SET†and “ADVANCE†buttons, and try to use the thin wire to lead the case. In addition, one end of the internal crystal oscillator is disconnected from the circuit board. Connect the small switch S3 with reference to the circuit diagram and fix the S3 to the side of the case (the space on the side of the watch just has this space), and connect the lead wires to the main circuit board. After debugging and restoring the electronic case, it can be debugged. Adjustment: Turn on the power, set the watch to “running timeâ€, S3 set calibration position, press SB to calibrate. When S2 is ×10 bits, R3 is adjusted to make the table display value 32.80S (theoretical value is 32.768S); when S2 is ×100 bits, R4 is adjusted so that the table display value is 3.28S.
Usage and precautions: 1. After measurement, the product of the displayed value and the gear position of S2 is the frequency of the measured signal, the unit is HZ. When S2 is in the ×10 gear, the error is 10HZ; when S2 is in the ×100 gear, the error is 100HZ. When the display value is >59.99S, the quantile value should be ×6000 and then added to the second digit value. 2. When the measured signal frequency is low, the display will not display properly. After the measurement is finished (ie, LED1 is illuminated), S3 is placed at the calibration position for reading. 3. The connection to the main circuit board should be as short as possible, especially the connection between C7 and S3. 4. The signal input to the table is preferably less than 1 MHz.
Function expansion: 1. If you want to measure higher signal frequency, you can use the method of adding frequency divider circuit before limiting, such as using a CD4017 to extend the range to 10MHZ. 2. If the capacitor, resistor (or inductor) in the oscillator composed of IC2 is replaced by the component to be tested, the parameter value of the above component can be measured according to the pulse period T of the oscillator in proportion to the component parameter. It is.
Simple digital frequency meter circuit diagram (2)In this paper, we use a frequency divider function of prescaler SAB6456A and high-speed digital divider 74HC390, combined with a new MSP430F449 microcontroller, to give a novel, fully automatic digital display measurement RF frequency design.
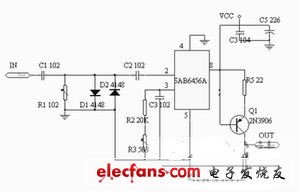
Figure 1 Signal front-end processing and frequency dividing circuit
Main device introduction
MSP430F449 microcontroller
The MSP430F449 features a 16-bit RISC architecture with extensive on-chip peripherals and high-capacity on-chip working registers and memory for a high price/performance ratio. Its features include:
Ultra-low power consumption: capable of operating from 1.8V to 3.6V; with operating mode (AM) and 5 low power modes (LPM). In low power mode, the CPU can be awakened by interrupts with a response time of less than 6ps.
· Strong computing power: 16-bit RISC structure, rich addressing mode; 16 interrupt sources, can be arbitrarily nested; instruction cycle can reach 125ns under 8MHz clock drive; internal hardware multiplier and a large number of registers, And up to 64KB of Flash program space and 2KB of RAM, to ensure the storage of data and operations.
· Rich on-chip peripherals: including watchdog timer, basic timer, comparator, 16-bit timer (TA, TB), serial port 0, 1, liquid crystal display driver, 6 8-bit I/O ports, 12-bit ADC (maximum sampling rate 200kHz) and so on. A rich set of on-chip peripherals makes it easy to build a more complete system. In addition, the multi-channel arbitrary waveform generation function and interrupt control function of the counter are fully utilized to ensure the completion of some complicated timing control tasks.
· Convenient and efficient development environment: MSP430F449 is a Flash-type device. There is a debug interface and an electrically erasable flash memory on the chip. You can download the program to the Flash first, and then run the software control program in the device, read by the JTAG interface. Take in-chip information for designers to debug. This method does not require an emulator and a programmer, and debugging is very convenient.
Prescaler SAB6456A
The SAB6456A is a prescaler designed for UHF/VHF. The internal MCpin is a frequency division control terminal, which can divide the frequency of the frequency range from 70MHz to 1GHz by 64/256. When the MC pin is open, it is divided by 64. When the MC pin is grounded, it is divided by 256. High sensitivity and strong harmonic suppression.
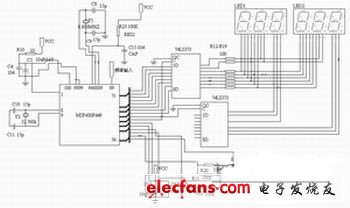
Figure 2 microcontroller peripheral circuit
working principle
The design is divided into two main parts: frequency division and counting. First, the input signal is clipped and divided by SAB6456A. ​​The 256-divided signal is divided by two 74HC390 high-speed crossovers. The analog signal becomes a low-frequency digital signal with a frequency below 10 kHz. Secondly, the sub-divided The signal after the frequency is directly connected to the MSP430F449 MCU, and the internal 16-bit timer A is used for timing and counting. The timer can be divided into several parts: the counter section, the capture/compare register, and the output unit. Among them, the counter has 4 working modes and 3 capture/compare registers. Using the continuous counting mode of the counter and the rising edge capture mode, the time of the N pulse signals is counted in the timer interrupt, and the frequency is obtained by dividing N.
hardware design
Figure 1 shows the front-end processing and crossover design of the signal. The output signal is divided by two SN74HC390s. The SN74HC390 is a high-speed crossover device with a maximum frequency division of 50MHz. Each SN74HC390 can achieve a frequency division of 100. It adopts two series connection, which can realize the frequency division of the signal by 1000. The frequency of the digital signal after frequency division is lower, about 4 kHz or less, which can be directly counted by the single chip microcomputer.
Figure 2 shows the peripheral circuit of the microcontroller, including the reset circuit, the power supply circuit and the crystal oscillator necessary for the operation of the microcontroller. The crystal oscillator has 8MHz and 32.768kHz, 8MHz is used as the counter input clock source of timer A; 32.768kHz is used as the display frequency of the digital tube. 74LS373 is a D-type latch, 5V single-supply power supply, because the output current is large enough, it can also directly drive the common cathode LG3631AH digital tube.
software design
Connect the divided output terminal OUT to the frequency input end of the MCU, and the program starts to delay for a period of time before the signal is stable. Open capture interrupt and timer A, count N pulses in timer A interrupt, get N pulses after measurement ends, then divide N to get the frequency of the pulse, multiply by the frequency division coefficient to get the actual frequency and display, after a short time Re-measure after delay, so cycle measurement and display.
When measuring the frequency, the LED display is turned off to ensure the accuracy. Therefore, for the lower frequency signal, the LED flashing occurs. The solution is to measure fewer pulses to reduce the average measurement time or reduce the delay.
Dynamic scanning display, the principle of dynamic scanning display is: P4 sends the scanning signal to each bit in turn, so that only one digital tube is strobed at each moment, and then P3 inputs the displayed font code to the bit to drive the The bit glyphs display glyphs. In this way, under the cooperation of the code segment sent by P3 and the bit segment sent by P4, each digital tube is alternately displayed with its respective glyph, and the display time of each bit is more than 1 ms, so that the human eye does not feel flicker.
The main measurement procedure is as follows:
Void frequency_measure(void)
{float tmp,tmp1;
Key_flag=0;//The button flag is cleared.
P1OUT|=BIT0;
Delay(1000); file://delay for a while and wait for the signal to stabilize
While(1)
{ IE2&=~0X80; file://off BT, off LED
Firstflag=1;//Start measuring the first pulse
TACTL|=TAIE; file://open capture
CCTL1|=CCIE;//Open timer a
While (f_ok_flag==0);//waiting for the end of the measurement
F_ok_flag=0;
If (aa1"aa2)
Overflow=overflow-1;
Tmp=aa2-aa1;
Tmp1=40.0/(overflow*0.008191875+(tmp/8000000.0));
Result=tmp1*0.256;
IE2|=0X80; / / open BT, open LED
Yanshi (2, 2); / / can modify the parameters here, the larger the longer the delay, too small, the LED will be dark
CCTL1&=~CCIE;//Off capture
TACTL&=~TAIE;//off timer a
Return;
}
}
The flow chart is shown in Figure 3.
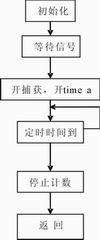
Figure 3 main program flow
Conclusion
The hardware and software given in this paper have been tested by practice, and the accuracy of the results measured by the measuring instrument is high. The measuring instrument is low in price and simple in structure, and is an economical frequency tester.
Product catagories of stylus pen for ipad, which is just for iPad Versions 2018 & 2019 and above.
It can work on following:
iPad 6th 2018: A1893/A1954
iPad 7th 2019: A2197/A2198/A2200
iPad 8th 2020: A2270/A2428/A2429/A2430
iPad air 3rd: A2152/A2153/A2154/A2123
iPad Air 4th: A2072/A2316/A2324/2325
iPad mini 5th: A2124/A2125/A2126/A2133
iPad Pro 1st/2nd 11: A1980/A2013/A1934/A1979/A2228/A2068/A2230/A2231
iPad Pro 3rd/4th 12.9: A2069/A2229/A2233/A2232/A1876/A2014/A1895/A1983
Stylus Pen For Ipad,Stylus Pen,Stylus Pen For Drawing,Touch Pencil
Shenzhen Ruidian Technology CO., Ltd , https://www.wisonen.com